How much has South Africa shipped to my market?
Weekly cartons by destination country and region, compared with the same week in each of the last four seasons.
 Fruitspan
Track South African fruit volumes into your market week by week, by fruit, variety, destination port and vessel. Then compare this season with the last four.
No card needed for the trial. Citrus, apples and pears, table grapes and stone fruit.
Exporters, marketers and shipping and logistics teams use it too, to benchmark volumes and plan by market and port.
Pick a fruit, a market, a variety or a vessel, and every chart and table follows. These are real Fruitspan screens.
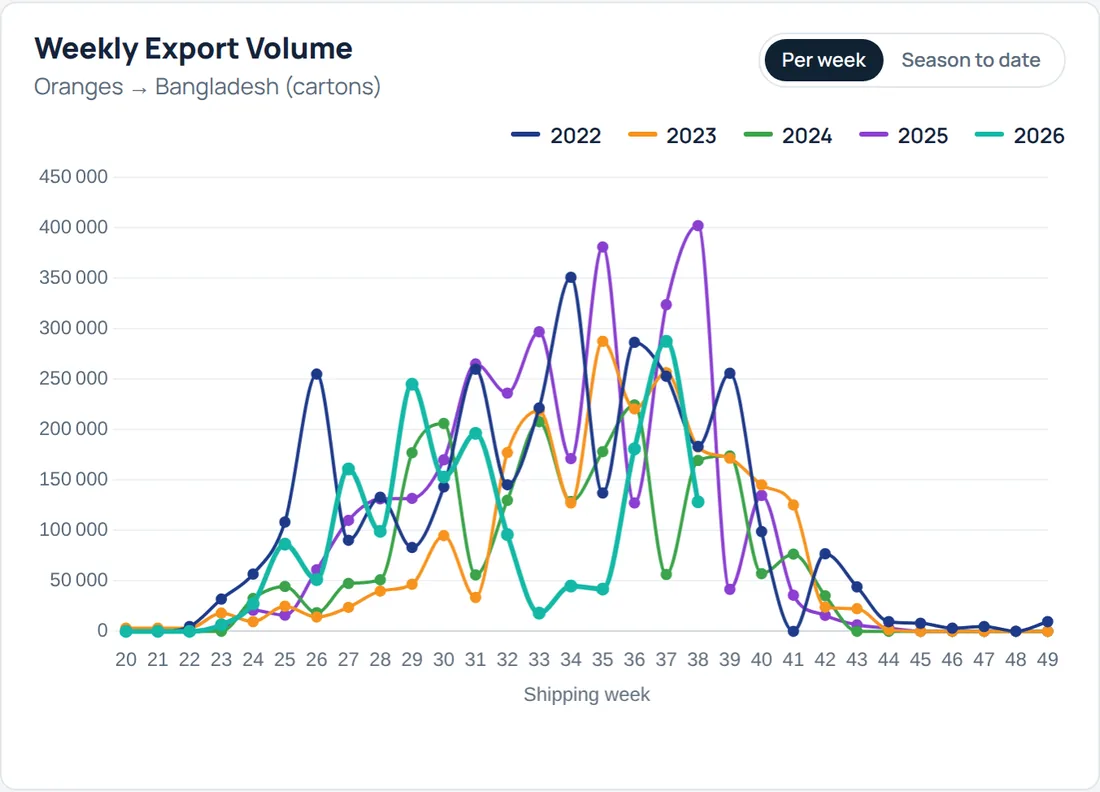
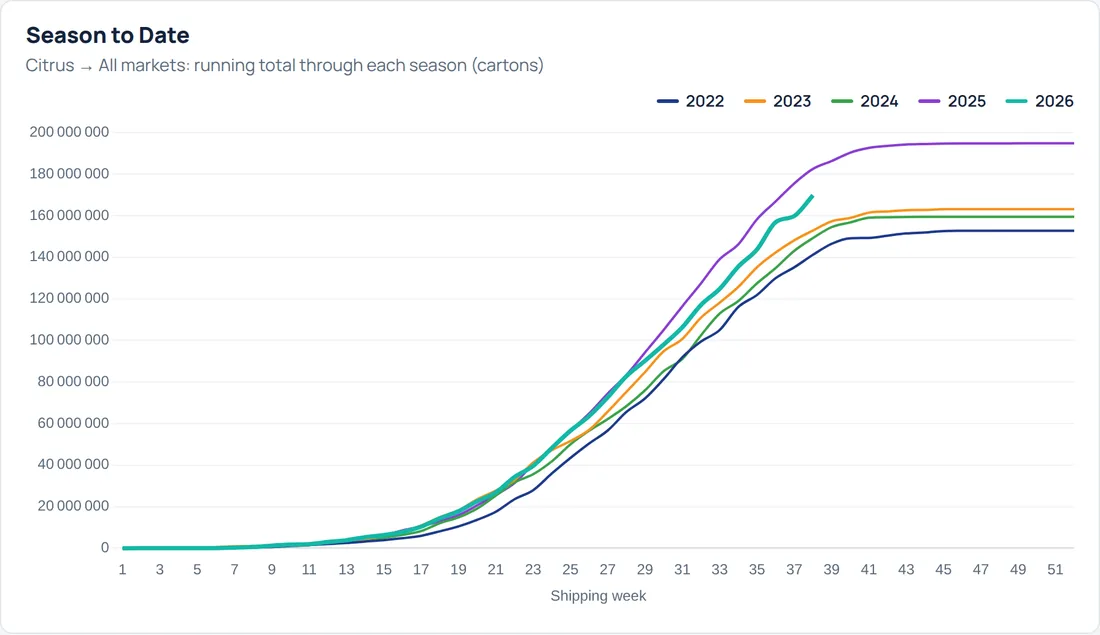
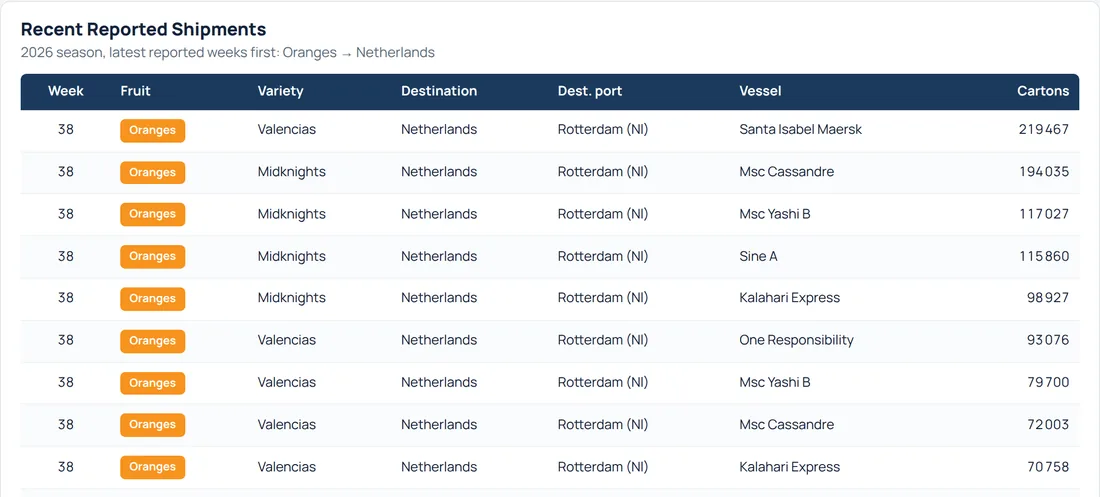
Weekly cartons by destination country and region, compared with the same week in each of the last four seasons.
Filter by fruit, variety group and variety to see when each one peaks, from early Clementines to late Valencias.
Volumes by destination port and vessel, and the latest reported shipments to any market, vessel by vessel.
Season-to-date totals against previous years, so you can plan buying and programmes with the numbers in front of you.
A weekly figure on its own says little. Fruitspan puts every week next to the same week in the four seasons before, so a dip, a surge or an early start stands out straight away, for your fruit and your market.
Each exporter sees their own shipments. Fruitspan brings the South African export picture for your market into one place, drawn from industry export statistics rather than one supplier's view: no piecing the season together from supplier updates, market talk and weekly statistics.
Turn any view into a one-page report: print it or save it as a PDF to share with your team.
A layout made for small screens, and you can add Fruitspan to your home screen to open it like an app.
Fruitspan reopens on the fruit, market and seasons you looked at last, on any device.
R550 a month (about $33 or €30 at today's rate)
or R5 000 a year, saving R1 600 (about $304 or €271 at today's rate)
Teams: a login for each person, R350 a seat a month from 5 seats
Both plans include everything: every fruit, five seasons of history, weekly updates, reports and downloads, on desktop and phone. Start with a 7-day free trial, no card needed. Cancel any time.
Start your 7-day free trial